I think we’ve all seen the graphs, like this one from the New York Times, that shows how spending at merchant categories have been impacted by the COVID-19 pandemic. Grocery and pharmacies are up year over year. Travel and restaurants are getting crushed. What we see less of, and what is just as important to payment geeks like me, is what is the impact of the pandemic on the overall use of cards?
For those of us who don’t have easy access to a transaction database. I posed that question to our colleagues at Facteus (formerly ARM Insight) and its newly released Enlightmint product. In this inquiry, we took a look at the total number of transactions on debit or credit cards.
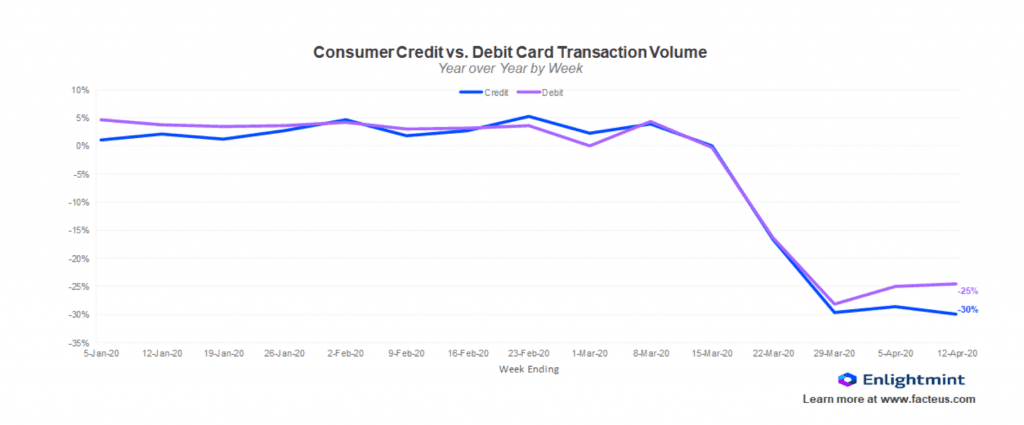
The graph below shows the year-over-year (YoY) change in debit and credit card transactions:

As the graph clearly shows, transaction volumes have clearly taken an unprecedented nosedive, with debit down 25% YoY and credit off 30% YoY. We all know the reasons for this slide: shelter in place orders, only select merchant categories allowed to stay open, consumer fear of catching the virus, etc.
The impact of this decline impacts not only the stores themselves and their suppliers. From a payment perspective, the networks, processors, gateways and acquirers who all depend on a portion of each transaction are also concerned. The statistician in me marvels at how closely these two lines follow the same trajectory. Alas, that is a story for another day.
There is a silver lining to this cloud – albeit a little tarnished. As the graph below shows, the YoY transaction size is actually up:
There are several ways to unpack this graph. First of all, despite the decline in the number of transactions (a proxy for the number of store visits physically and digitally), average spend per transaction is actually up YoY. It is easy to say this is attributable to people stocking up on toilet paper and other essentials at the grocery store. That may be true, but I would argue that other factors are also at play.
For example, people are limiting the number of times they go to the grocery store from a few times a week to maybe once, which would also drive up average ticket size. Furthermore, consumers are buying items (or reasonable facsimiles) at open stores, which they would have gotten at other stores, thus driving up ticket size. I’m sure there are several other contributors to the rise in ticket size I’m not thinking of at the time of this writing.
At the end of the day, while it is simple to place singular blame on many of the changes in consumer behavior we are seeing, I think we need to be more realistic. One simple answer makes us all feel better, but understanding the complexities of the changes we see and their lasting implications will be imperative for coming out on the winning end of this crisis.
Overview by Peter Reville, Director, Primary Research Services at Mercator Advisory Group