
PSCU, the nation’s premier payments credit union service organization, has updated its weekly transaction analysis from its Owner credit union members on a same-store basis to identify the impact of COVID-19 on consumer spending and shopping trends.
To provide relevant updates on market performance, experts from PSCU’s Advisors Plus and Data & Analytics teams today released year-over-year weekly performance data trends. In this week’s installment, PSCU compares the 29th week of the year (the week ending July 19, 2020 compared to the week ending July 21, 2019).
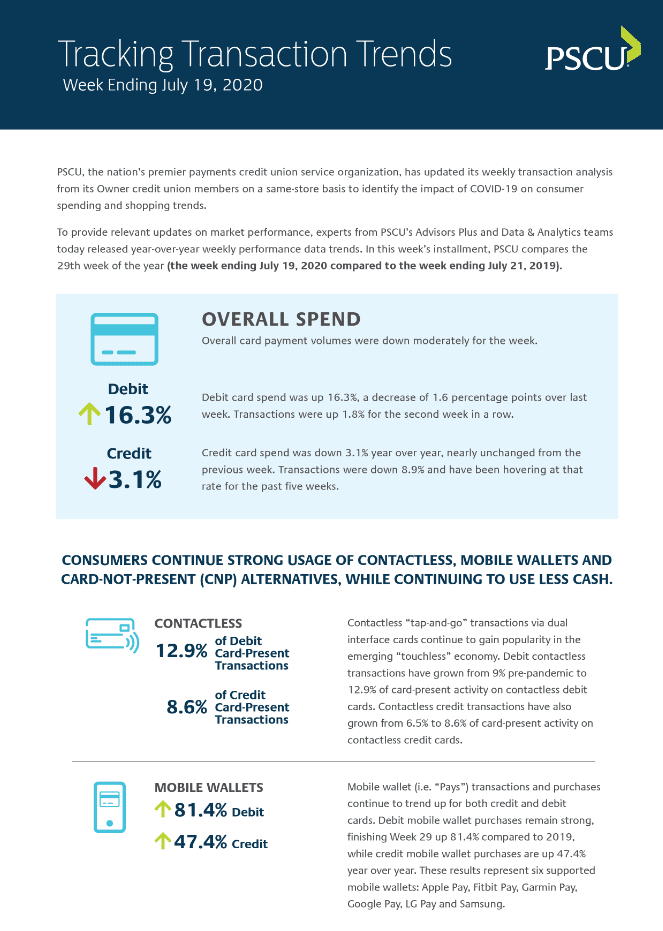
- Overall card payment volumes were down moderately for the week.
- Debit card spend was up 16.3%, a decrease of 1.6 percentage points over last week. Transactions were up 1.8% for the second week in a row.
- Credit card spend was down 3.1% year over year, nearly unchanged from the previous week. Transactions were down 8.9% and have been hovering at that rate for the past five weeks.
- Consumers continue strong usage of contactless, mobile wallets and card-not-present (CNP) alternatives, while continuing to use less cash.
- Contactless “tap-and-go” transactions via dual interface cards continue to gain popularity in the emerging “touchless” economy. Debit contactless transactions have grown from 9% pre-pandemic to 12.9% of card-present activity on contactless debit cards. Contactless credit transactions have also grown from 6.5% to 8.6% of card-present activity on contactless credit cards.
- Mobile wallet transactions and purchases continue to trend upfor both credit and debit cards. Debit mobile wallet purchases remain strong, finishing Week 29 up 81.4% compared to 2019, while credit mobile wallet purchases are up 47.4% year-over-year. These results represent six supported mobile wallets: Apple Pay, Fitbit Pay, Garmin Pay, Google Pay, LG Pay and Samsung.
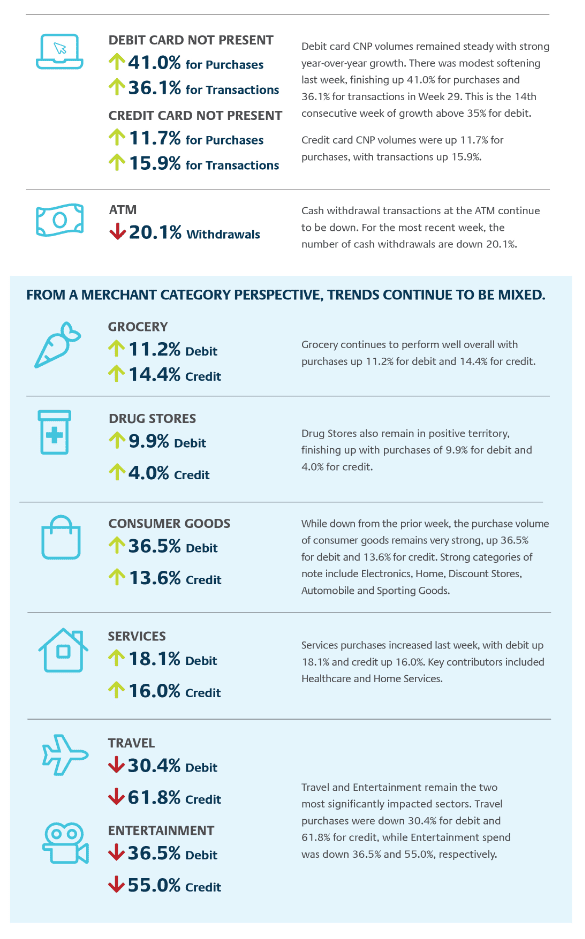
- Debit card CNP volumes remained steady with strong year-over-year growth. There was a modest softening last week, finishing up 41.0% for purchases and 36.1% for transactions in Week 29. This is the 14th consecutive week of growth above 35% for debit.
- Credit card CNP volumes were up 11.7% for purchases, with transactions up 15.9%.
- Cash withdrawal transactions at ATMs continue to be down. For the most recent week, the number of cash withdrawals was down 20.1%.
- From a merchant category perspective, trends continue to be mixed.
- Grocery continues to perform well overall with purchases up 11.2% for debit and 14.4% for credit.
- Drug Stores also remain in positive territory, finishing with purchases up 9.9% for debit and 4.0% for credit.
- While down from the prior week, the purchase volume of consumer goods remains very strong, up 36.5% for debit and 13.6% for credit. Strong categories of note include Electronics, Home, Discount Stores, Automobile and Sporting Goods.
- Services purchases increased last week, with debit up 18.1% and credit up 16.0%. Key contributors included Healthcare and Home Services.
- Travel and Entertainment remain the two most significantly impacted sectors. Travel purchases were down 30.4% for debit and 61.8% for credit, while Entertainment spend was down 36.5% and 55.0%, respectively.
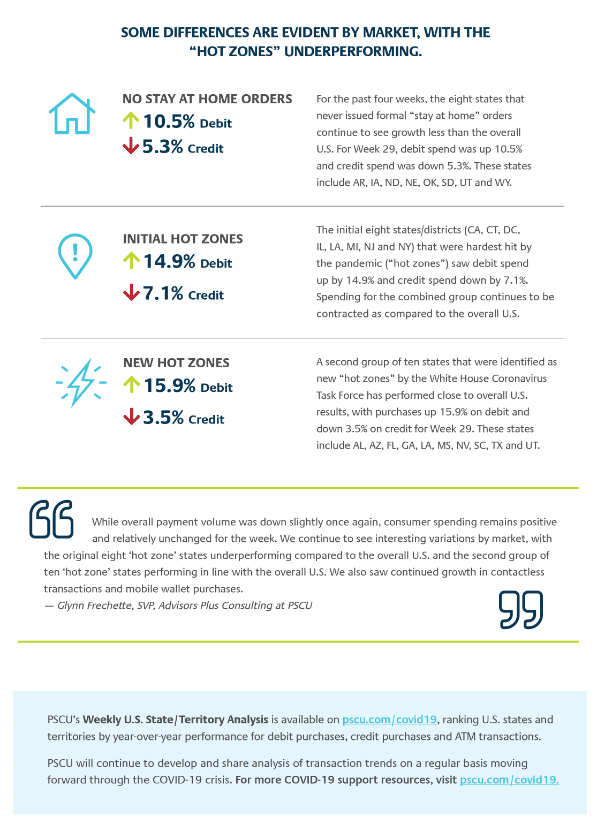
- Some differences are evident by market, with “hot zones” underperforming.
- Overall U.S. spend was up 16.3% for debit and down 3.1% for credit.
- The initial eight states/districts (CA, CT, DC, IL, LA, MI, NJ and NY) that were hardest hit by the pandemic (“hot zones”) saw debit spend up by 14.9% and credit spend down by 7.1%. Spending for the combined group continues to be contracted as compared to the overall U.S.
- For the past four weeks, the eight states that never issued formal “stay at home” orders continue to see less growth than the overall U.S. For Week 29, debit spend was up 10.5% and credit spend was down 5.3%. These states include AR, IA, ND, NE, OK, SD, UT and WY.
- A second group of 10 states that were identified as new “hot zones” by the White House Coronavirus Task Force has performed close to overall U.S. results, with purchases up 15.9% on debit and down 3.5% on credit for Week 29. These states include AL, AZ, FL, GA, LA, MS, NV, SC, TX and UT.
- More detailed state-level information is available via PSCU’s Weekly U.S. State/Territory Analysis, available on PSCU.com/COVID19. This includes a weekly ranking of all U.S. states and territories by year-over-year performance for debit purchases, credit purchases and ATM transactions.
“While overall payment volume was down slightly once again, consumer spending remains positive and relatively unchanged for the week,” said Glynn Frechette, SVP, Advisors Plus at PSCU. “We continue to see interesting variations by market, with the original eight ‘hot zone’ states underperforming compared to the overall U.S. and the second group of 10 ‘hot zone’ states performing in line with the overall U.S. We also saw continued growth in contactless transactions and mobile wallet purchases.”
PSCU will continue to develop and share analysis of transaction trends on a regular basis throughout the COVID-19 crisis.