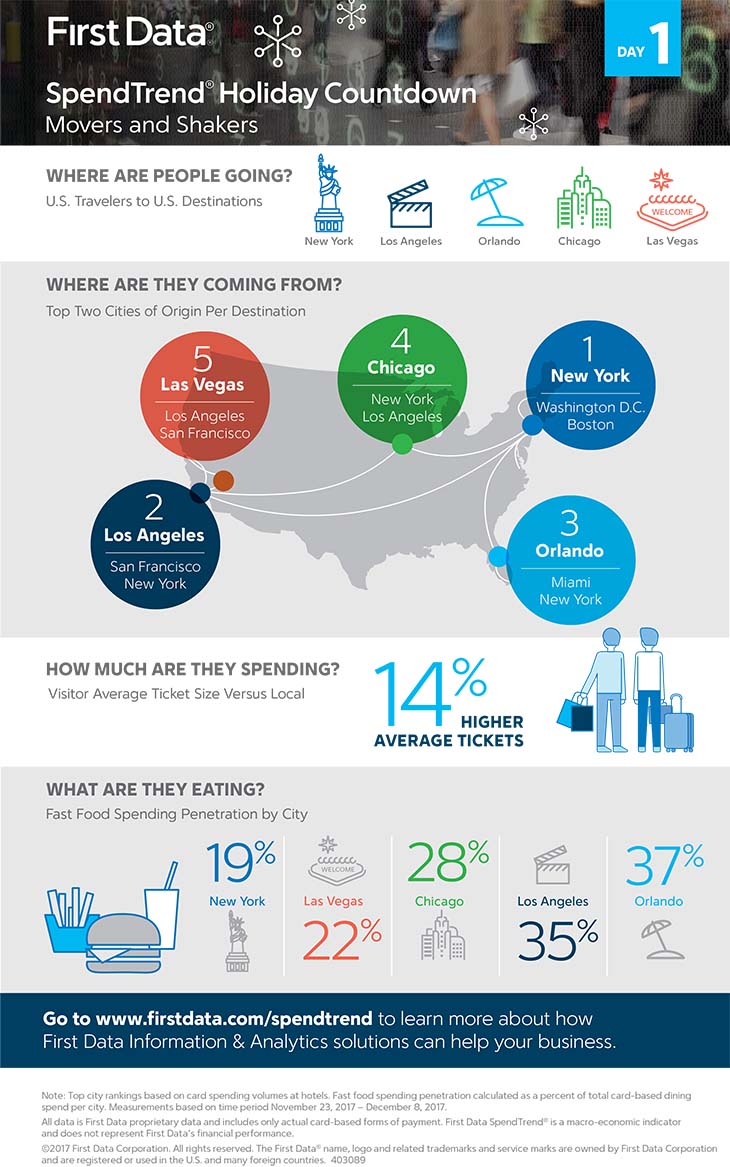
First Data’s SpendTrend Holiday Countdown is a 5-day infographic look at a variety of perspectives on commerce across the holiday season. Monday’s inaugural publication examined the “Movers and Shakers” of the holiday season, identifying where people are traveling to and from, their pace of spend and a quick glance into their eating habits. The full week-long series can be found here.
First Data’s SpendTrend product is a macro-economic indicator based on aggregate same store sales activity across the merchant locations First Data processes transactions for in the U.S. First Data has been actively monitoring sales trends for the holiday shopping season, and its team of market intelligence experts provide deep insight into consumer spending patterns across all major retail verticals. For this infographic, the top city rankings are based on card spending volumes at hotels, and fast food spending penetration is calculated as a percent of total card-based dining spend per city. Measurements are based on transactions processed from November 23, 2017 – December 8, 2017.